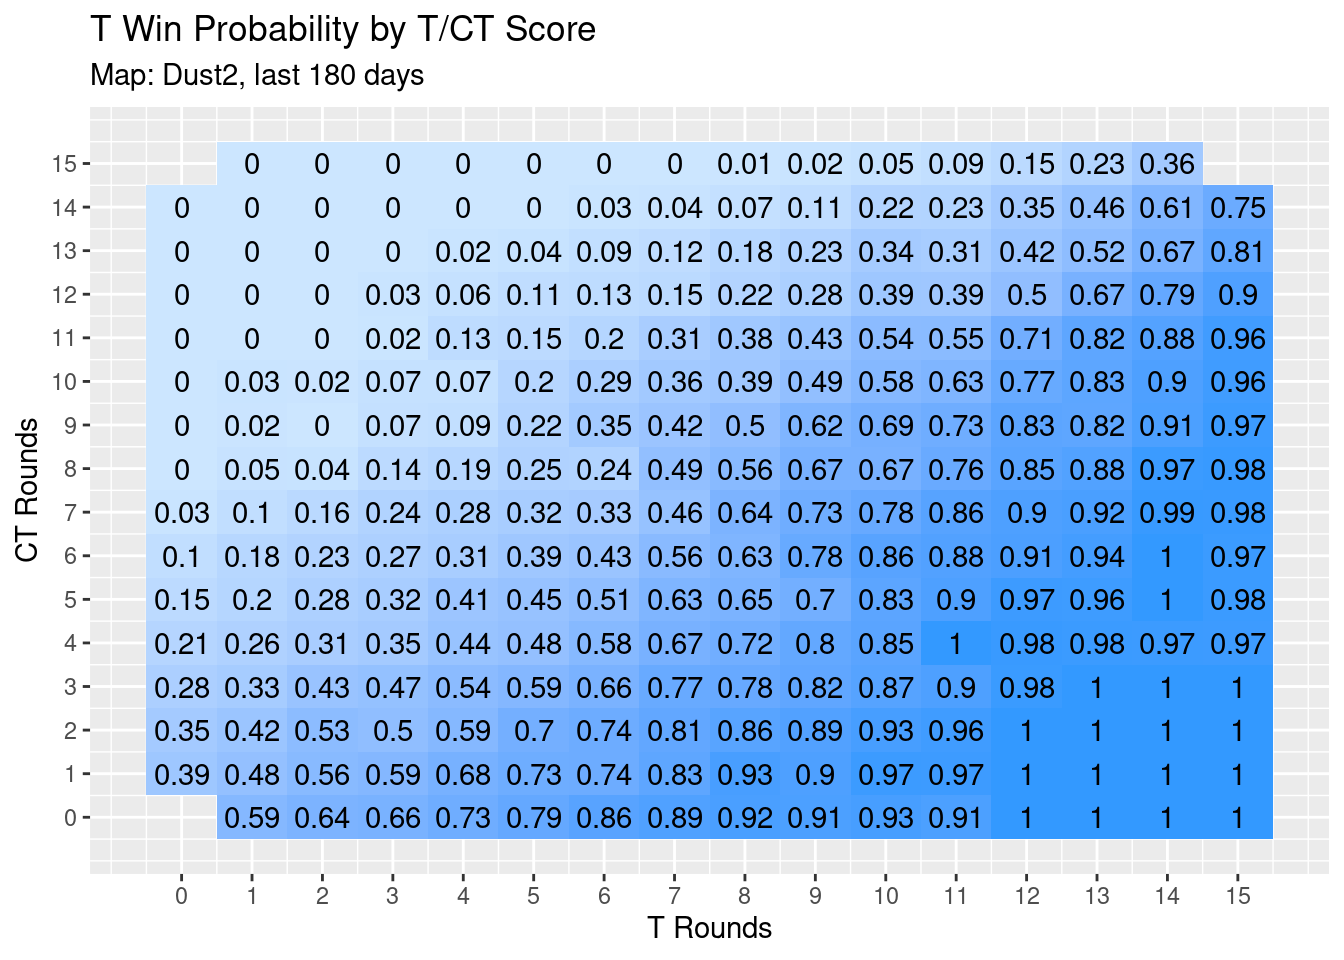
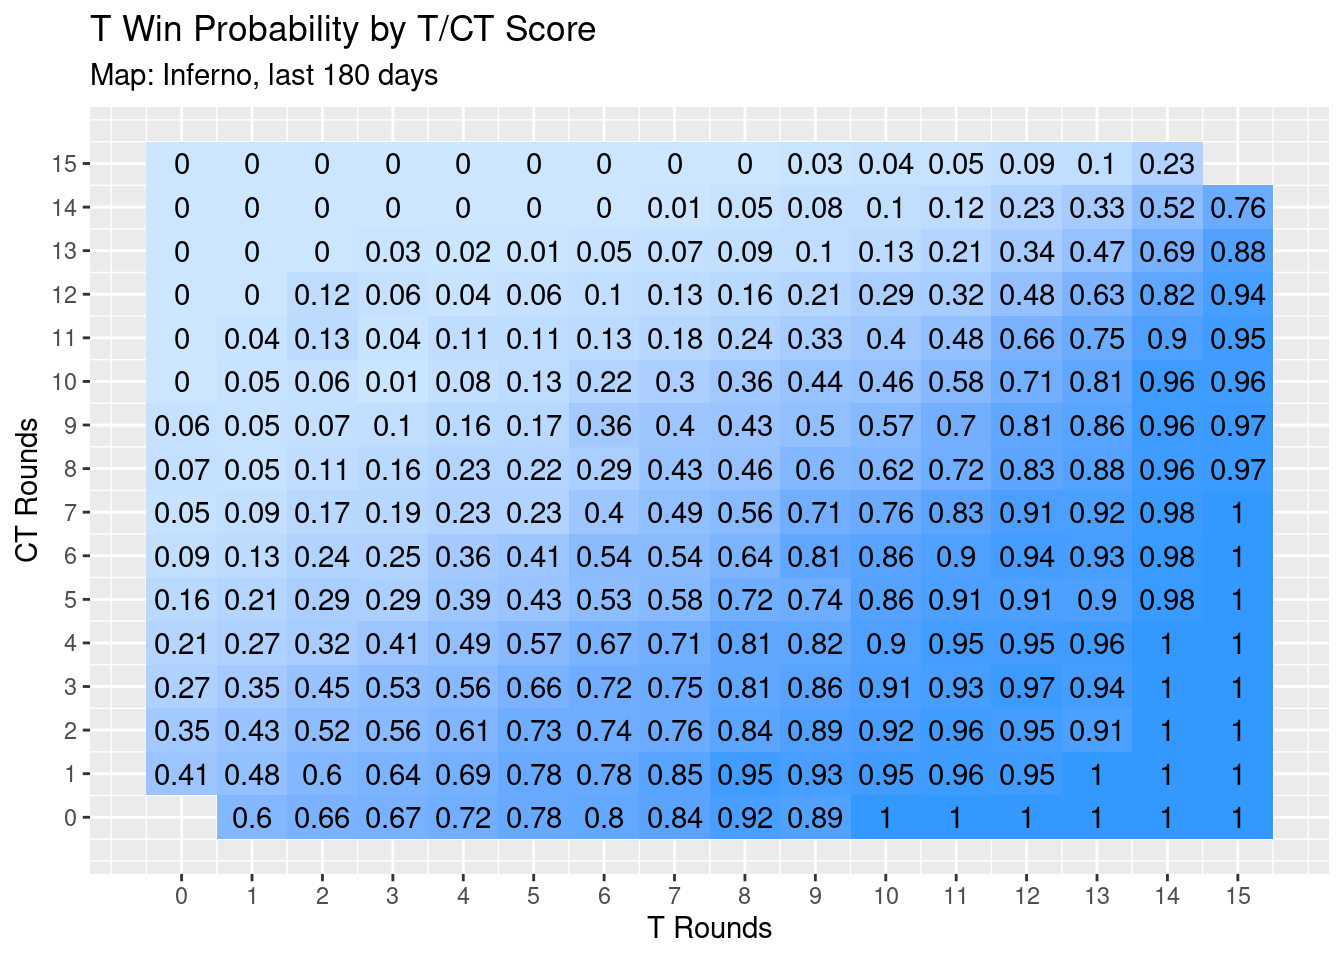
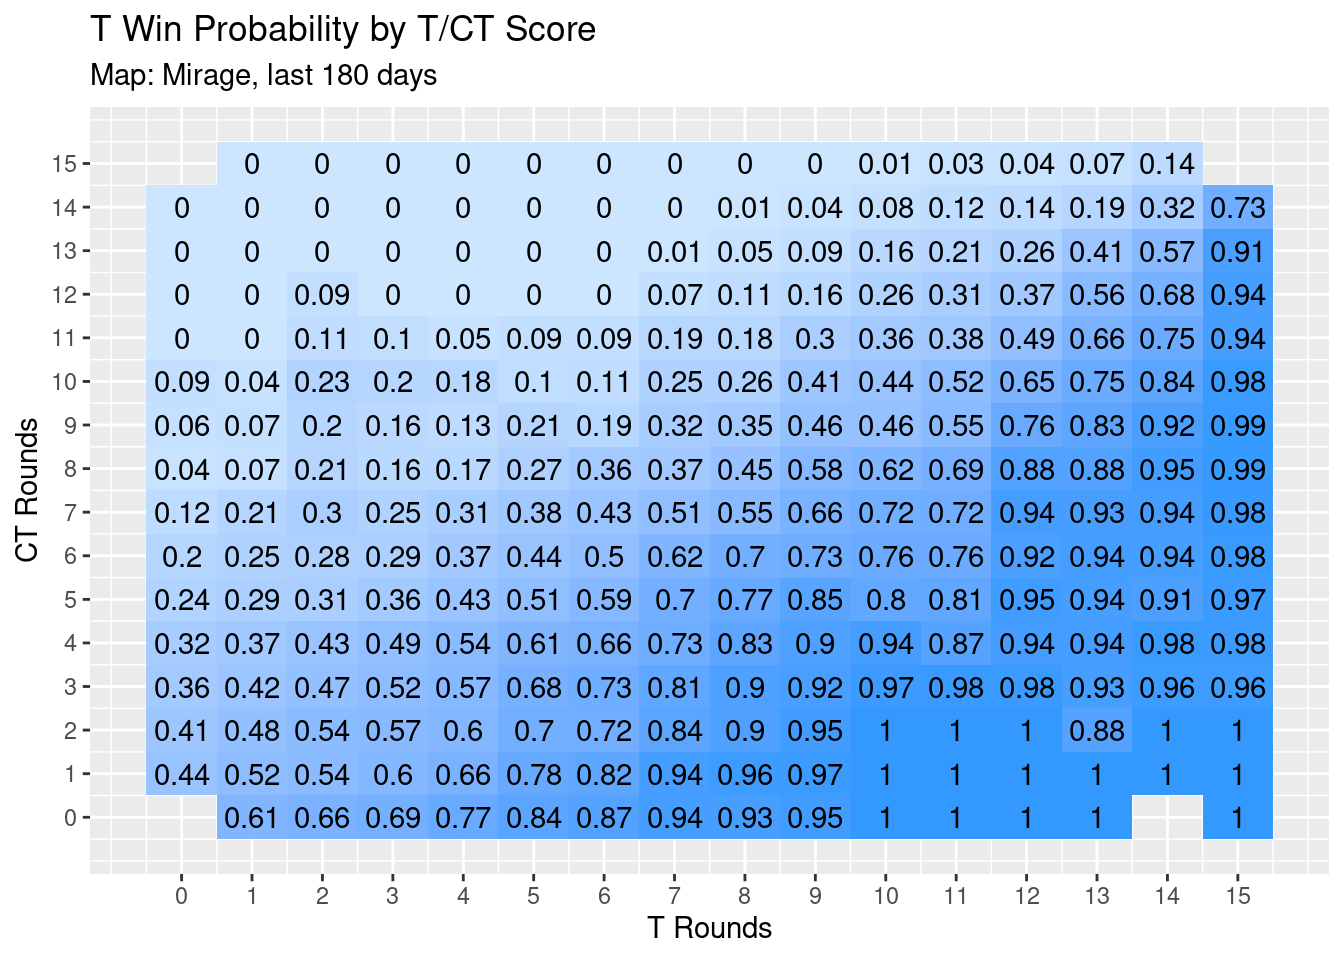
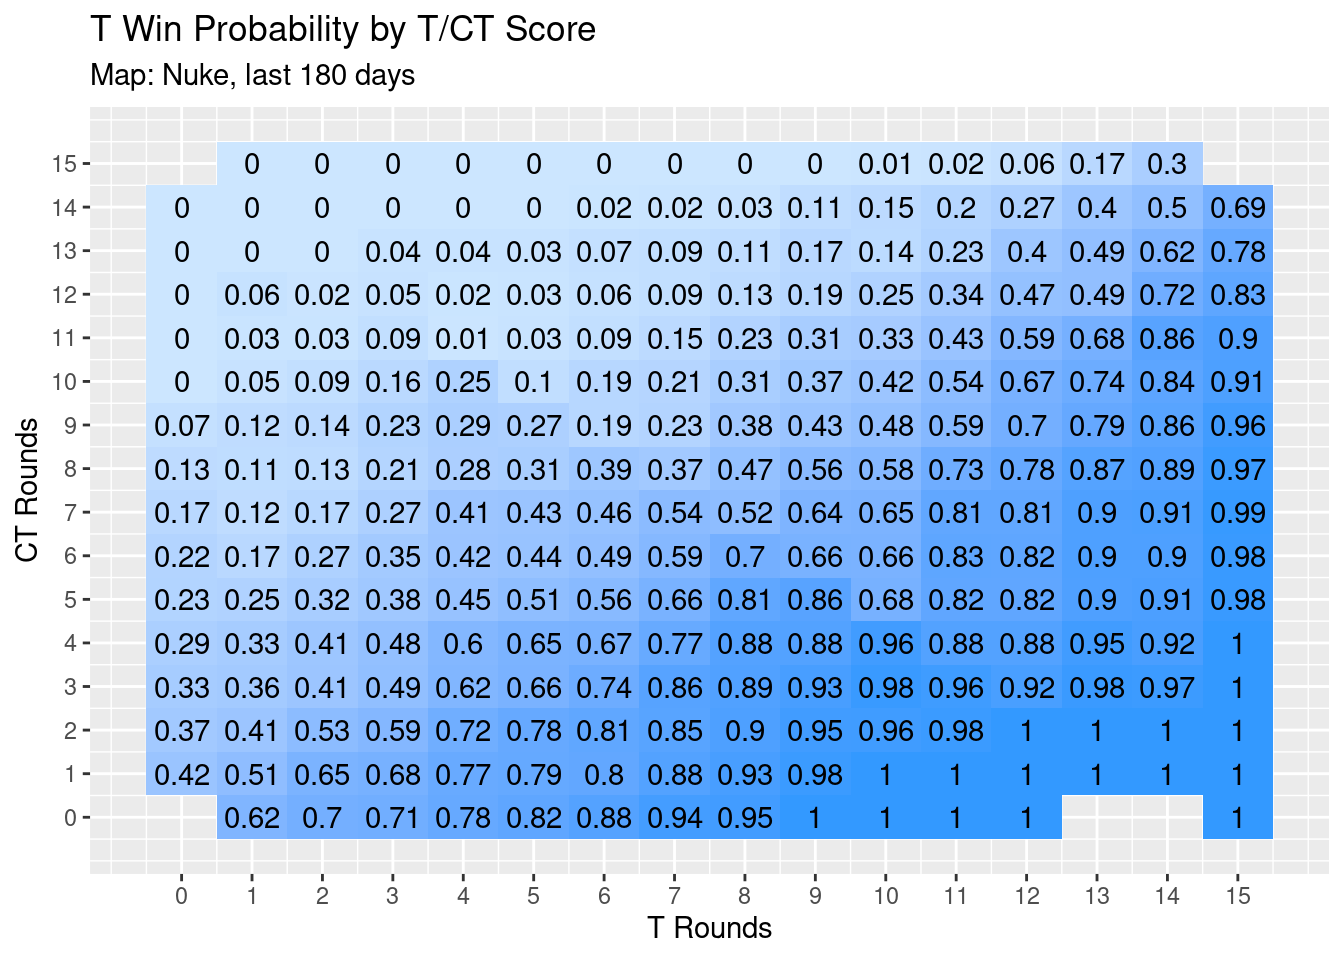
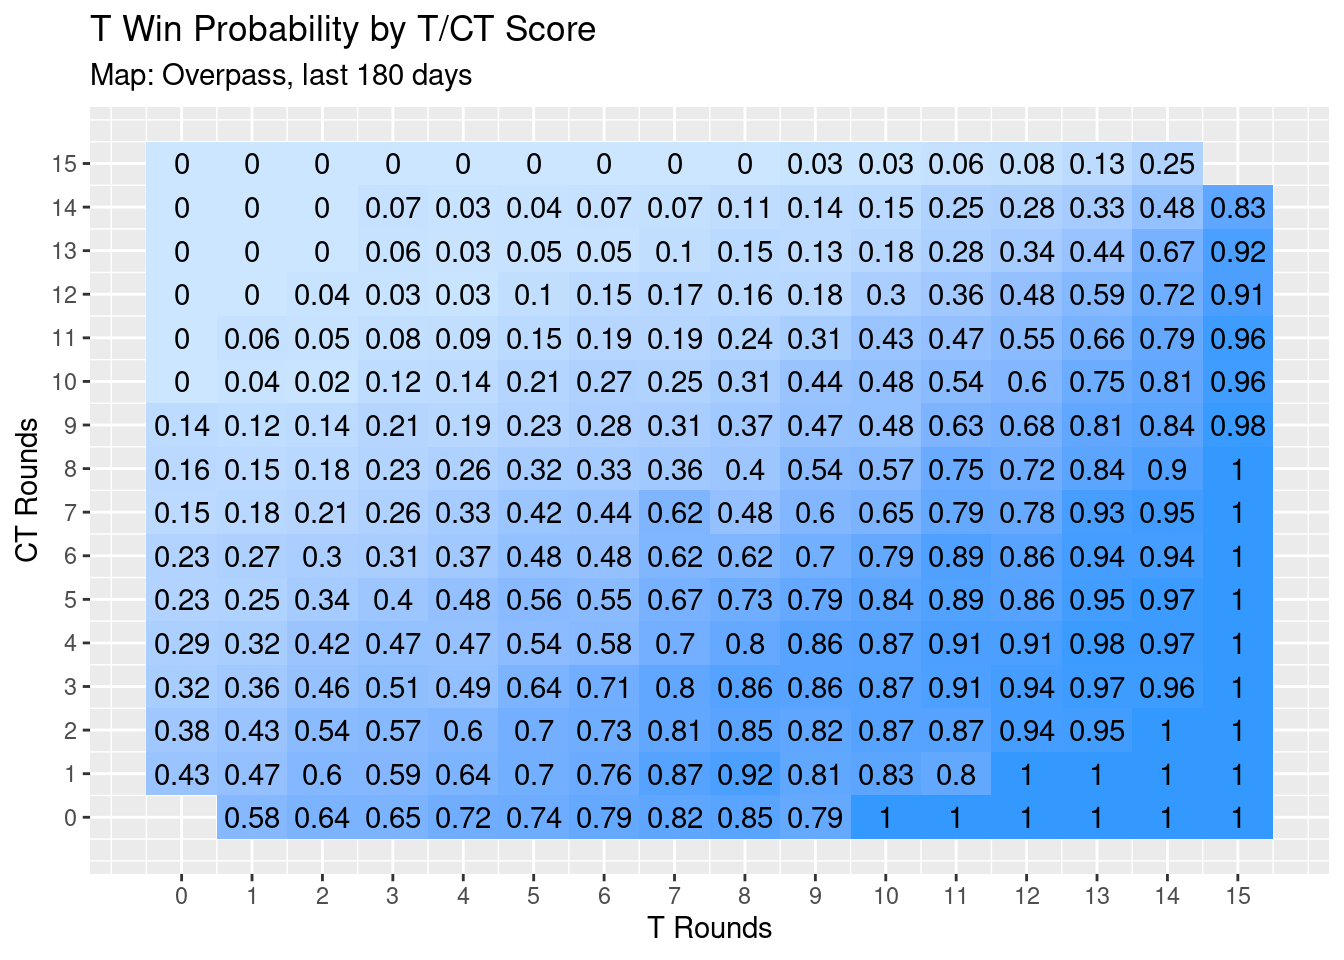
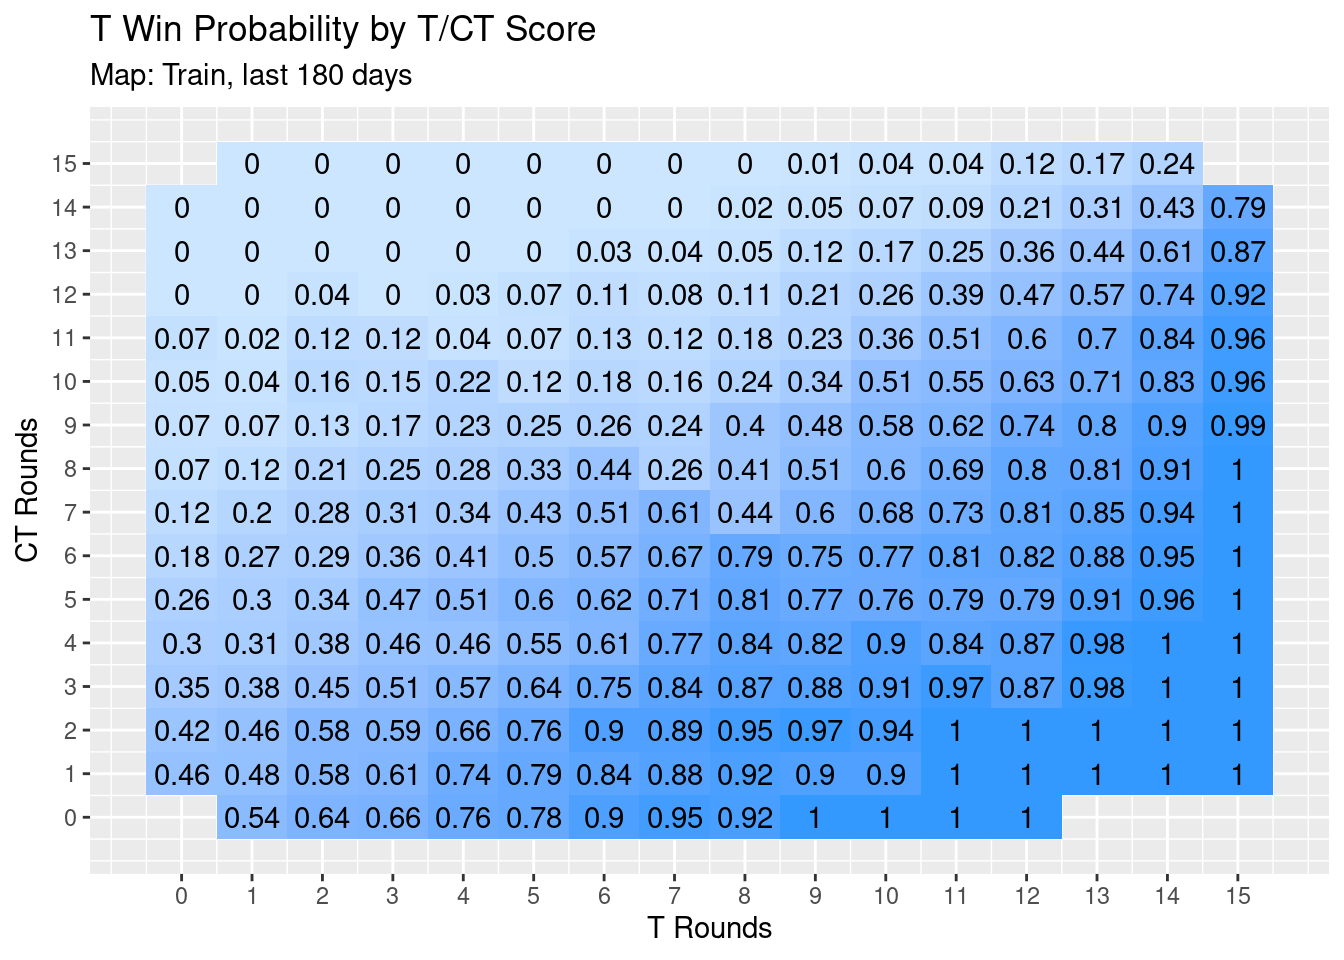
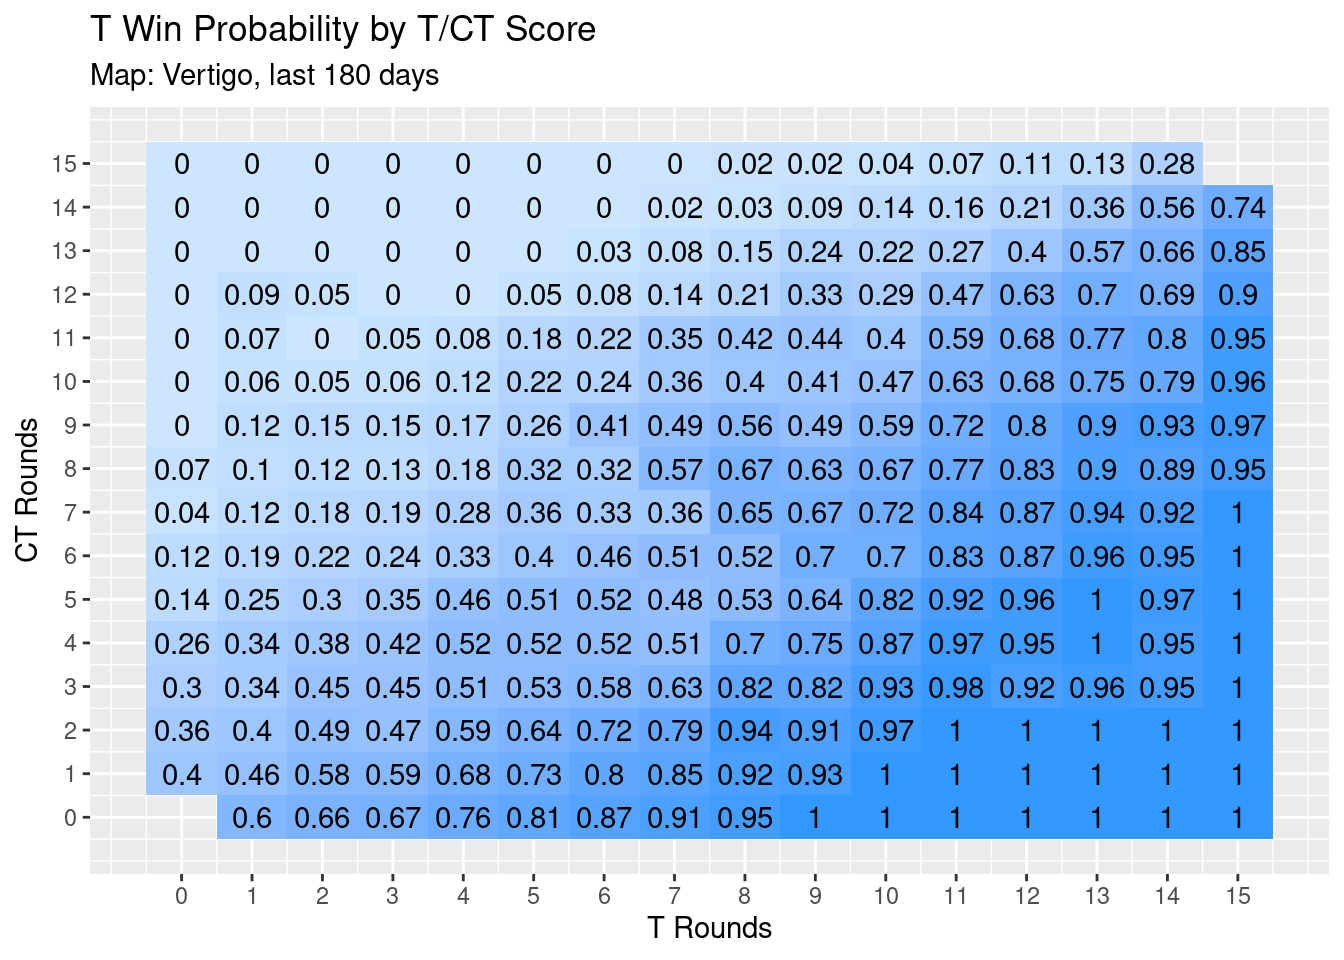
Map Win Probability
Brian Salerno
July 14, 2020; Updated August 17, 2020
The following graphics are “unsmoothed” win probability heatmaps for the T side of the designated map. The “unsmoothed” refers to the fact that these heatmaps are based solely off of past results, and the probabilities are not necessarily monotonically increasing with more round wins. This means that the T win probability for 11-5 can somehow be greater than the win probability for 12-5, for example. Clearly, the 12-5 score would imply a higher chance to win than 11-5, but since these heatmaps are based on real data, there are some inconsistencies with this property.
The maps can be interpreted as such:
Given a score of [T] - [CT], the T side has won X% of the time.